Original: An integrated Index of Lethality for full auto weapons, posted December 27th 2015
Author: leptis
VERSION 3 (FINAL)
This thread comes from the discussion with @Miffyli (creative discussion!!!) about which is the parameter to describe a dimension in a weapon (Thread Multidimensional Analysis). This is just an exercise to integrate individual parameters of weapons in an index and doesn’t pretend to be THE RANKING of weapons because those rankings depend strongly on the set initial conditions.
Philosophical principle: A gun is better than another if it wins in an individual engagement (is faster delivering the damage>100), and the measure of that is the probability of delivering it.
The case analyzed is: full auto weapons (55 weapons), ADS, naked gun (or fixed attachements such as PDWs) and perfect aiming. Other strategies (microbursts, auto or manual), recoil correction or different points of aiming for each weapon to optimize the bursts are not considered. Time to ADS is not considered.
Weapon Features are taken from @Veritable table (Thanks!!!), filling some gaps (Base values of Hrec and Spread). When discrepancies are found with Symthic stats, these values are taken (mainly AS VAL and GROZA).
1st step: Generate 2,000 bursts of 10 rounds for every weapon in 10 m intervals up to 100 m (these weapons haven´t significant results further than 50 m). Evaluate if each bullet hits and where (stom., chest, head or missed). Register the damage.
That means: 20,000 bursts for each weapon, 1,100,000 total burst, 11,000,00 “virtual” shots.
The methodology here:
The coordinates (angular) of the bullet Âi in a burst are:
RECOIL
Xri=Xi-1+ random [Hleft, Hright]; (no recoil in first shot)
Yri= Yi-1+ RecoilV.FSM.random [0,95,1,05]
FSM=1 except i=2 (no recoil in first shot)
SPREAD
Xsi= random [0, SpreadBase+(i-1).SIPS]. COS(random[0,360])
Ysi= random [0, SpreadBase+(i-1).SIPS]. SIN(random[0,360])
Note that Random numbers has to be the same in X and Y to be consistent.
MaxSpread is not reached with 10b Burst.
TOTAL CARTESIAN COORDINATES AT DISTANCE
Xi=Xaim+D.TAN(Xri+Xsi)
Yi=Yaim+D.TAN(Yri+Xsi)
HITBOX
Head 0.20m (width) x 0.30 m (height), damage multiplier = 2,13
Chest 0.50m (width) x 0.30 m (height), damage multiplier = 1
Stomach 0.50 m (width) x 0.40 m (height), damage multiplier = 0.93
Arms and legs are not considered (the burts go mainly upward).They are similar to Test Field targets. Defensive spec is not considered.
The aiming point was X=0 and Y=0,35, centered in the intuitive center of mass of torso.
EXCEL was used.
This is not new, because it follows in the footsteps of Hitrater, Simplot and Plotic.
2nd step: Classified by distance, register on each individual burst: Total Damage, Number of Bursts that produces DMG > 100, Number of Bullets that hits the target, Number of Shots (not bullets, because some of them may be missed) that causes DMG > 100, Time to Kill (where DMG > 100) and many other parameters. This analysis within the burst is new.
This TTK is different than common TTK in Symthic because it takes into account missed bullets and time to reach the target (velocity of bullet). In fact it is:
TTK=(Distance/Vbullet)+(60/ROF-1).(Nshots to kill-1)
Note that the first shot is done at Time=0 and I compute total shots to kill instead of bullets on target to kill. An analysis of sensibility shows that Vbullet has
importance at range to change the TTK.
3rd step: Get the statistical parameters for the above values for each set of 2000 bursts at a given distance (Mean, Standard Devt., quartiles, max., min, etcÂ
).
The analysis shows that the relevant parameters are:
- Probability the burst is effective (DMG > 100)= Efective Bursts/Total Bursts
- TTK defined as above.
We have the following graphs.
Mean DAMAGE in the bursts / DISTANCE:
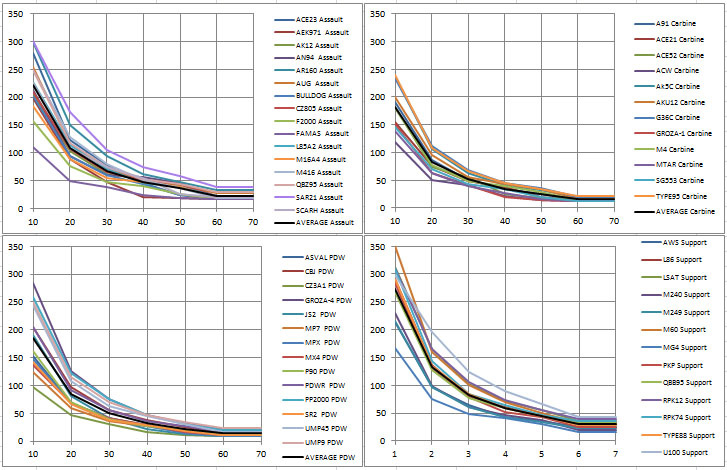
Average Mean DMG/DISTANCE by class:
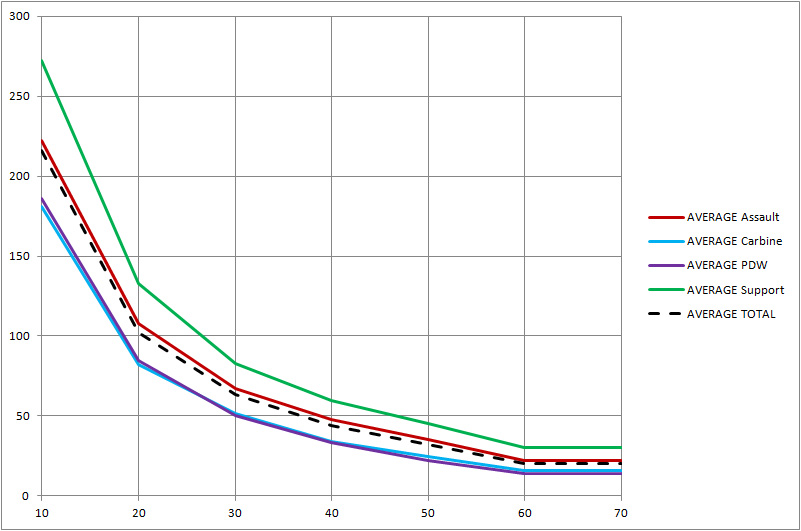
PDW are OP and out of its natural position (as powerful as carbines).
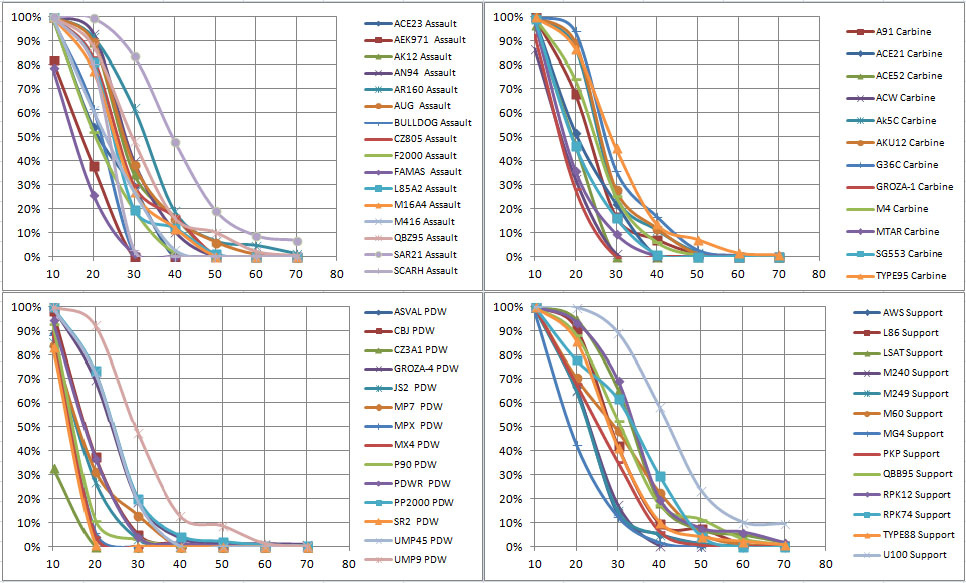
Probability of DMG >100/DISTANCE:
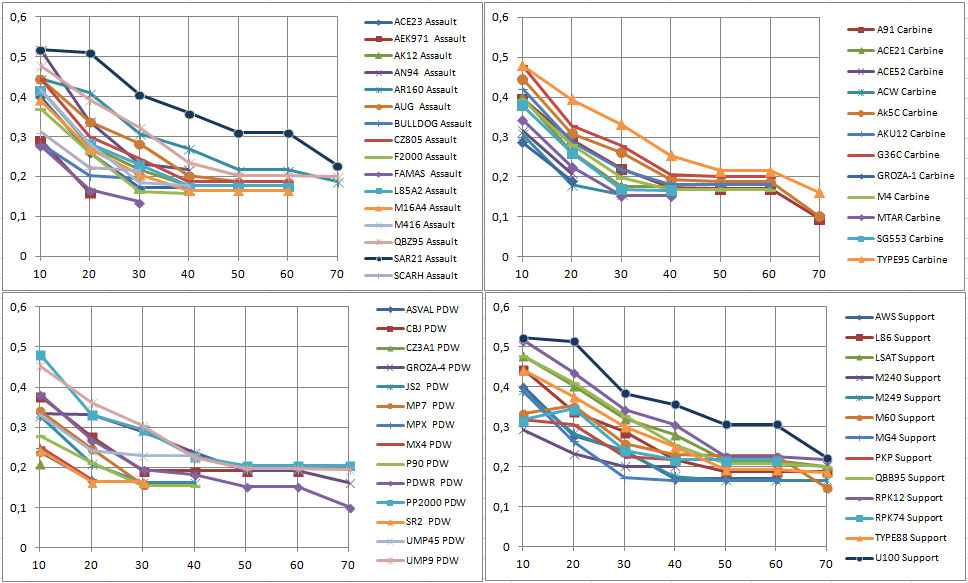
TTK (seconds) /DISTANCE:
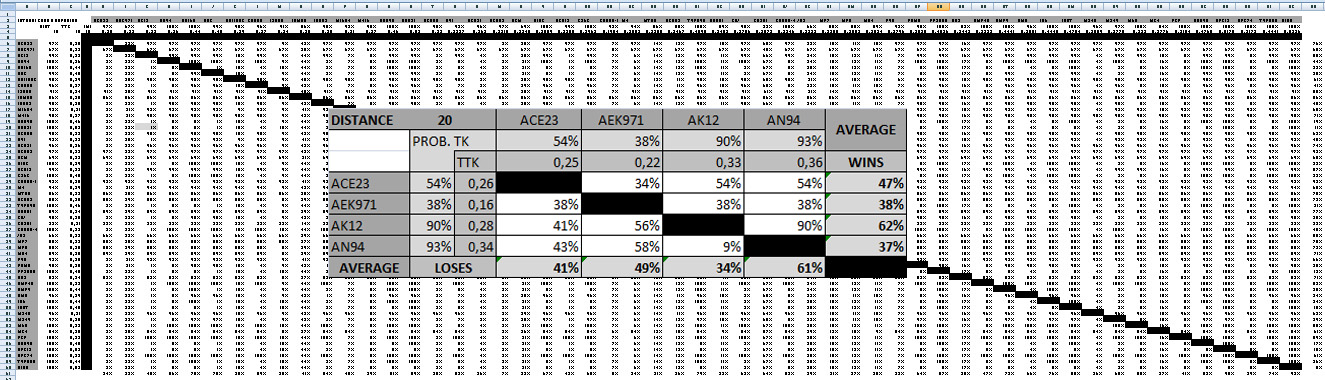
4th step: Compare the weapons in pairs. That is, huge 55x55 matrices at each distance, with the probability to win.
The algorithm is explained here because it is a complicated problem.
We have to compute
Kill-Fail
Fail-Kill
Fail-fail
If Prob1 is the probability of effective burts at a DISTANCE for Weapon1 (faster; lower TTK) and Prob2…etc… Weapon2 (slower, higher TTK)
WEAPON1 wins with probability=Prob1
WEAPON2 wins with probability=(1-Prob1).Prob2 ; When Weapon1 fails.
Both fail with probability=(1-prob1).(1-Prob2)
There is other not computed case (kill-kill) with very, very small probability (typically where TTK curves crossing).
The sum of the rows gives us the sum of winning percentage and column and the percentage of losses.
Actually this is not rigorous because it presumes the frequency of use of weapons is uniform (the engagements are not equi-probable). But we don’t know it, so…
Average values are calculated.
Here you see an image of a matrix and a sample of 4 weapons to understand how it works.
Now we have the integrated probability to win for each weapon against other ones. Here you see the results for AR:
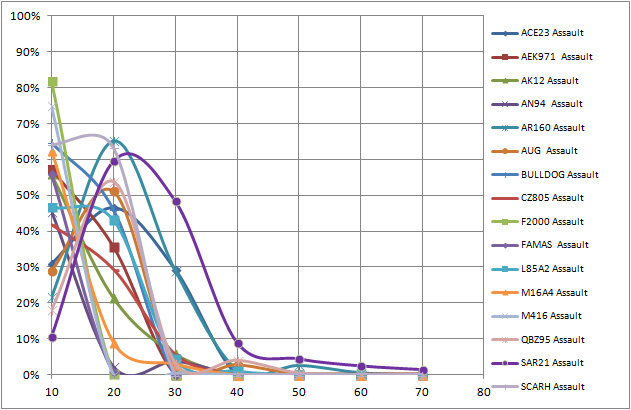
The “waves” are due to curved option.
Note that it shows there are good weapons for CBQ (F2000 or ACE23) and good ones for long range (SAR-21). The results are fully consistent.
5th step: Are all distances of combat equally probable? We know they are not. We have the @Miffyli curves of probabilities of engagement. We weight the results for each distance with that probability, we add the probabilities weighted, we convert that to the scale 0-10 … and FINALLY!!! we have THE INTEGRATED INDEX OF LETHALITY (sorry for the name!!!:-)) that integrates ROF, RECOIL, SPREAD, DAMAGE (D) and BULLET VELOCITY (no weighted values are shown to compare the effect of weighting.Scale 0-10).
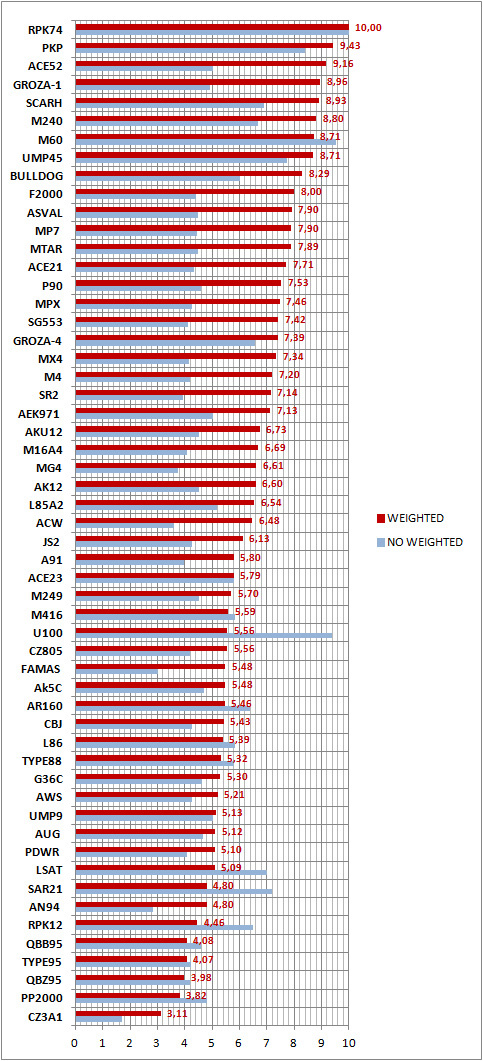
Next steps: Which are the probability that you could produce that results?. It depends on the availability of ammo, which depends on the size of the magazine and reload time … but sorry, I’m exhausted now :-).