Original Post: Analysis of BF4 weapons based on player statistics, posted April 9th 2014
Author: untamedone
Purpose:
I always wanted to include the human element in calculating weapon performance as you compete against other players and not against other weapons.
Data Source:
This data is from pmax from the Nerdy Statistics thread. Thanks for letting me use your database.
Assumptions and Notes:
There are many factors that are included in these tables that can’t be isolated without better stats from DICE. Range, attachments, and play style are averaged out over the players. We can’t know at what range all kills were made or if some players prefer moving close range hipfire only. We do know that this is on average what you will encounter in public servers regardless of what it may be.
The SR338 has no kills in the random sample, I guess no one wants to use it yet. Data is pre Naval-strike SR338 wasn’t unlockable. The tables will need to be updated some time in the future.
AK-12 and AKU-12 are in burst in the tables, but it is likely most people use them on auto.
How to read tables
Each weapon type has a section with four tables.
-
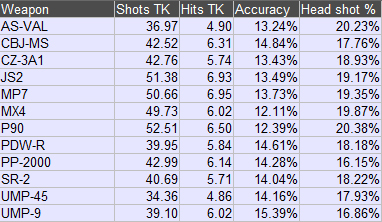
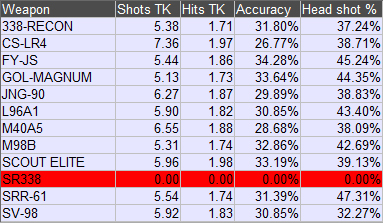
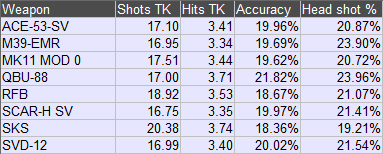
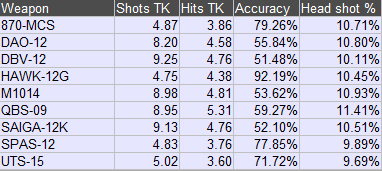
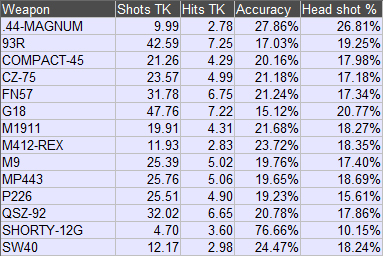
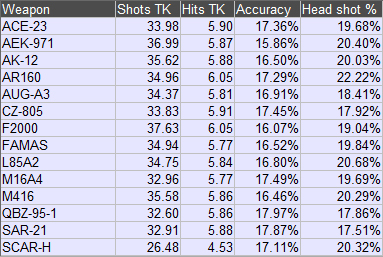
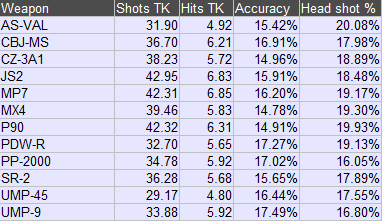
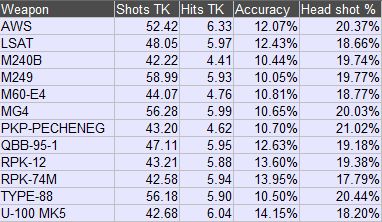
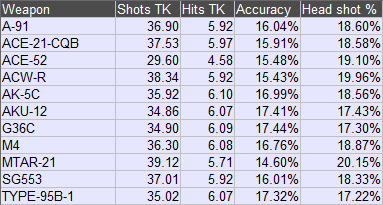
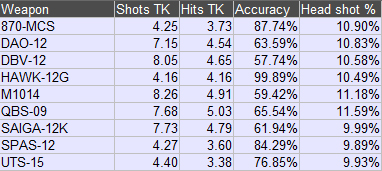
performance metrics sorted by name
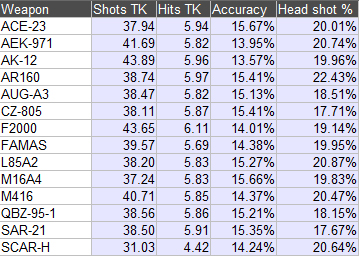
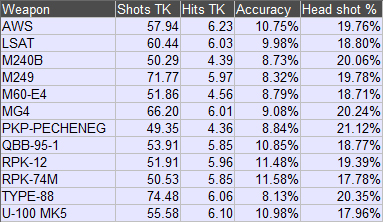
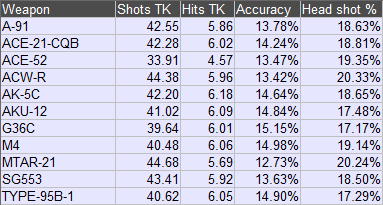
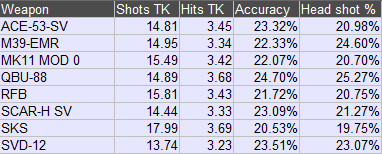
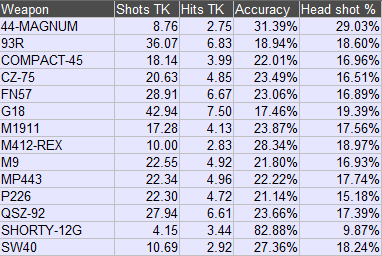
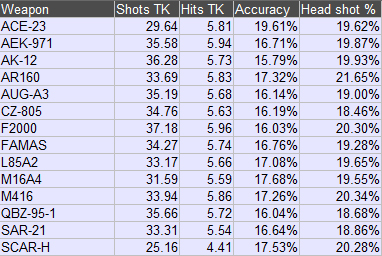
- Shots to Kill, this is the average number of shots fired to get a kill
- Hits to Kill, this is the average number of hits required to get a kill.
- Accuracy, the average percentage of shots that hit
- Headshot %, the average percentage of kills by headshot
-
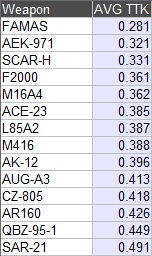
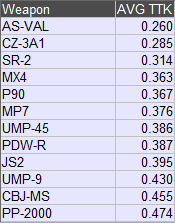
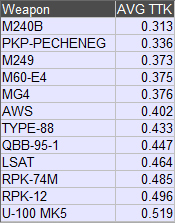
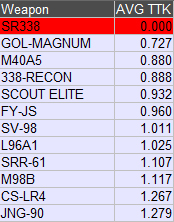
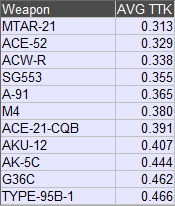
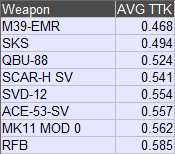
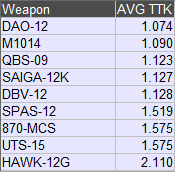
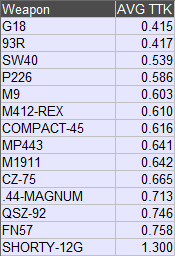
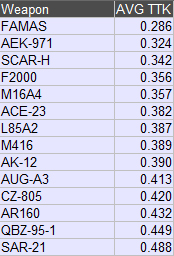
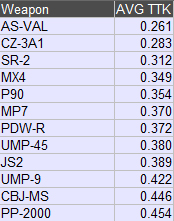
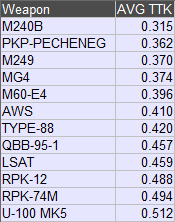
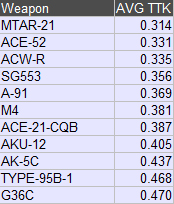
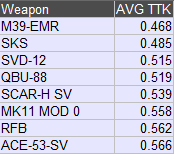
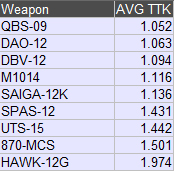
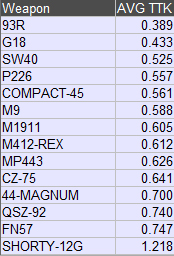
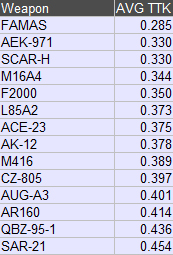
sorted by average time to kill
- This contains the weapons sorted by average time to kill in seconds.
-
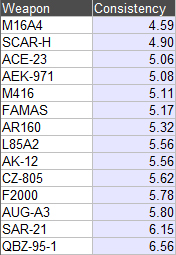
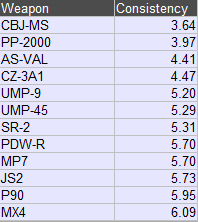
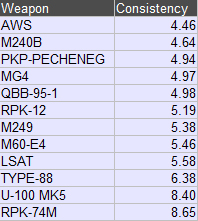
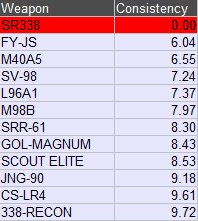
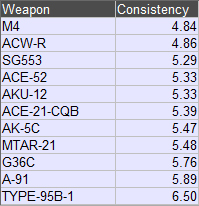
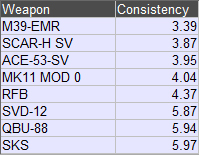
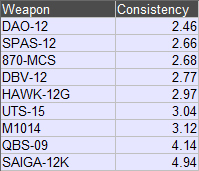
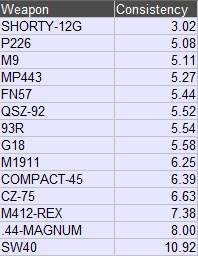
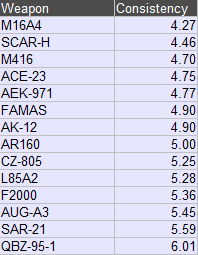
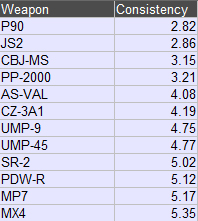
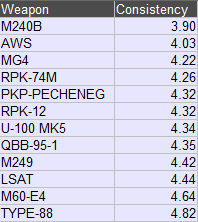
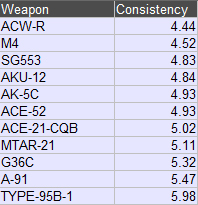
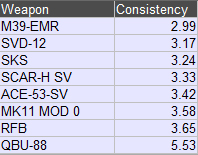
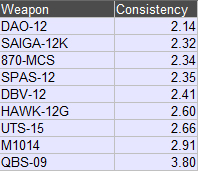
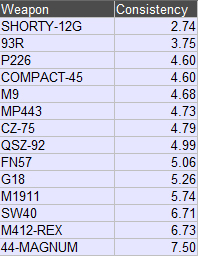
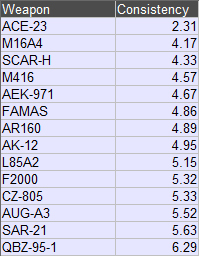
sorted by consistency
- consistency is time to kill with mag size and reload speed factored in. It estimates how well a weapon will perform against multiple targets, lower is better.
- consistency formula:
( shots / kills ) / ( effective rpm / 60 ) + ( (roundup( ( shots / kills ) / mag size ) -1 ) * fast reload speed )
-
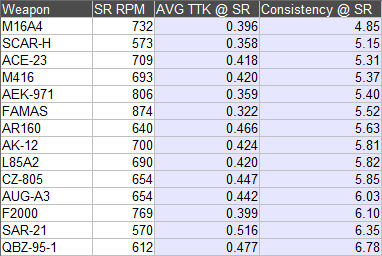
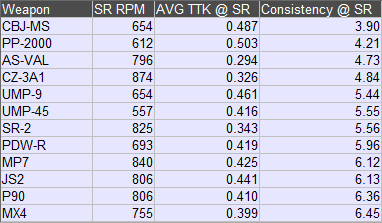
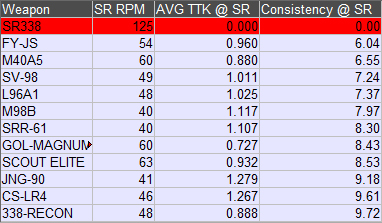
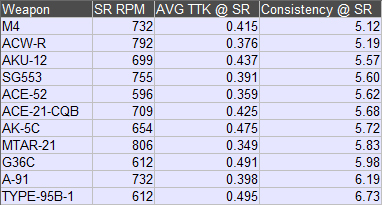
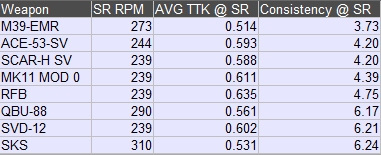
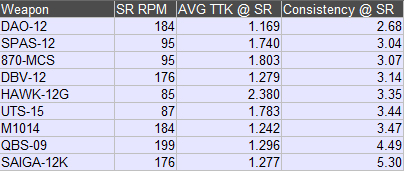
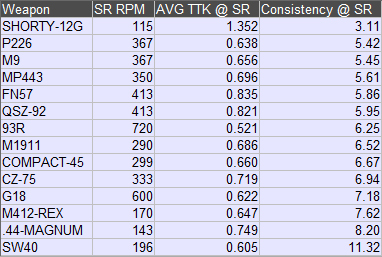
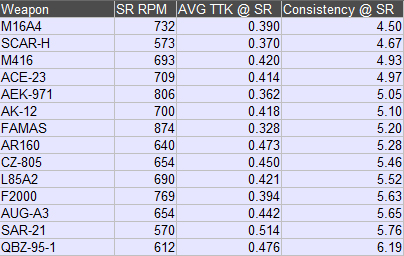
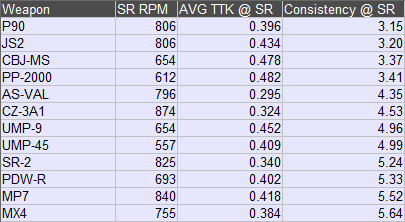
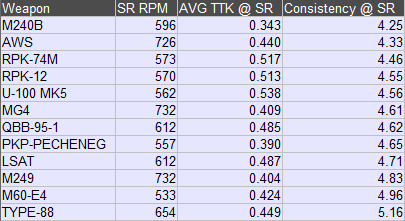
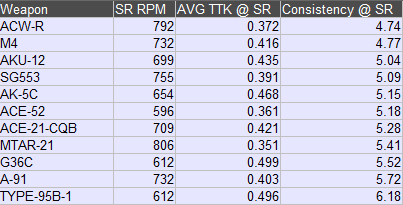
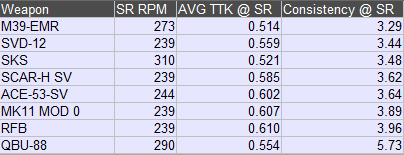
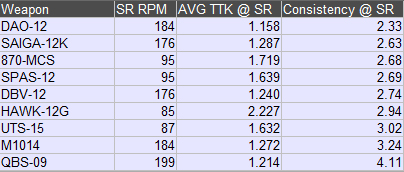
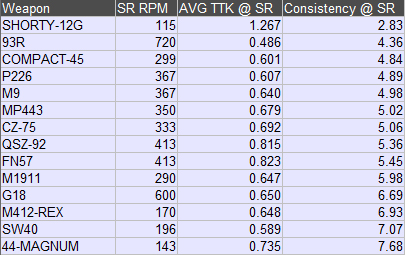
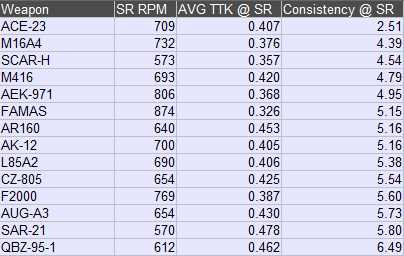
adjusted for spread recovery sorted by consistency
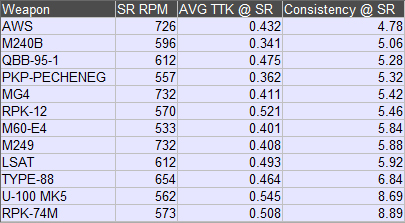
- SR RPM, the round per minute of the weapon when fired at spread recovery
- AVG TTK @ SR, the average time to kill in seconds with the rounds per minute adjusted for spread recovery
- Consistency @ SR, consistency rating with the rounds per minute adjusted for spread recovery
Average Player Stats
Assault
Performance metrics sorted by name
Sorted by average time to kill
Sorted by consistency
Adjusted for spread recovery sorted by consistency
Engineer
Performance metrics sorted by name
Sorted by average time to kill
Sorted by consistency
Adjusted for spread recovery sorted by consistency
Support
Performance metrics sorted by name
Sorted by average time to kill
Sorted by consistency
Adjusted for spread recovery sorted by consistency
Recon
Performance metrics sorted by name
Sorted by average time to kill
Sorted by consistency
Adjusted for spread recovery sorted by consistency
Carbine
Performance metrics sorted by name
Sorted by average time to kill
Sorted by consistency
Adjusted for spread recovery sorted by consistency
DMR
Performance metrics sorted by name
Sorted by average time to kill
Sorted by consistency
Adjusted for spread recovery sorted by consistency
Shotgun
Performance metrics sorted by name
Sorted by average time to kill
Sorted by consistency
Adjusted for spread recovery sorted by consistency
Sidearm
Performance metrics sorted by name
Sorted by average time to kill
Sorted by consistency
Adjusted for spread recovery sorted by consistency
Conclusions:
The time to kill charts line up decently with the other methods, but the consistency charts are where the surprises are as no one has attempted them yet.
This data is based on a sampling of your average player, so a sampling of better than average players will likely change the tables.
The engineer consistency tables seem unusual. The CBJ-MS and the PP-2000 have such large mag sizes that the shots to kill for them are lower than the mag sizes. This means you can keep on shooting while the other PDWs are frequently reloading. The hits to kill seem to point to them being used at longer ranges than the other PDWs with the same damage model. They seem to be more effective at 20m-30m mag-dumping than I initially thought.
On the DMR consistency tables it appears players are either spamming the SKS to their detriment or having difficulty at range with lower damage and bullet speed. It’s stats should really put it in the top half of the charts.
Better than average player stats
Assault
Performance metrics sorted by name
Sorted by average time to kill
Sorted by consistency
Adjusted for spread recovery sorted by consistency
Engineer
Performance metrics sorted by name
Sorted by average time to kill
Sorted by consistency
Adjusted for spread recovery sorted by consistency
Support
Performance metrics sorted by name
Sorted by average time to kill
Sorted by consistency
Adjusted for spread recovery sorted by consistency
Carbine
Performance metrics sorted by name
Sorted by average time to kill
Sorted by consistency
Adjusted for spread recovery sorted by consistency
DMR
Performance metrics sorted by name
Sorted by average time to kill
Sorted by consistency
Adjusted for spread recovery sorted by consistency
Shotgun
Performance metrics sorted by name
Sorted by average time to kill
Sorted by consistency
Adjusted for spread recovery sorted by consistency
Sidearm
Performance metrics sorted by name
Sorted by average time to kill
Sorted by consistency
Adjusted for spread recovery sorted by consistency
Conclusions:
The top players are more accurate across all tables, but nearly the same in headshot proficiency.
The TTK charts are very similar in weapon order:
- Assault and Engineer TTK tables are the exact same order.
- Carbine tables have the G36C and the TYPE-95B-1 swapped.
- Recon tables have the SRR-61 dropping lower for top players.
- Support tables have the MG4 and M60 swapping as well as the RPK-12 and RPK-74M swapping.
- DMRs only have the M39 and SKS on top the same.
- Sidearms have some mixing at the top and mid where TTK were very close for average players.
- Shotguns have the biggest scrambling with only the HAWk the same. This is likely due to different shotgun ammo.
The consistency tables have larger changes due to drastic increases in accuracy.
The largest example being the P90 and JS2 jump to the top in Engineer consistency due to the increase in accuracy reducing the shots to kill below the mag size.
Special Request:
Assault top 100 kills
Performance metrics sorted by name
Sorted by average time to kill
Sorted by consistency
Adjusted for spread recovery sorted by consistency
Note that this isn’t the top 100 in the world, just the top 100 in the database.