Original Post: More nerdy statistics of BF4 players and battlereports, posted January 15th 2015
Author: @Miffyli
1. Distribution of played maps
Quite simple: Following bunch of text shows distribution of played maps and their fractions.
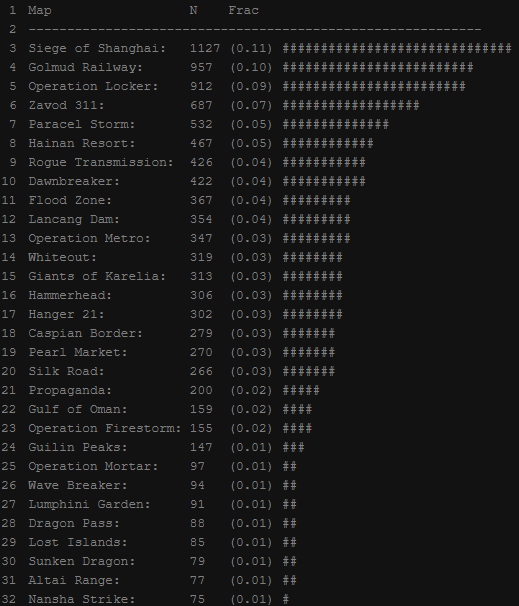
Of course, this is not the most fairest comparison as Final Stand was released about 2-3 months ago while max age of these reports were 4 months. However we can see
that original maps seem to be quite popular. Final Stand maps seem to come next which can be explained by it’s freshness.
I can come up with two possible explanations for this distribution:
- There are more non-premium/non-DLC players than premium players. Vanilla map servers are more active because non-premium players -> more players join them -> more games played.
- New maps are somewhat “throw-away” and premium players move mostly to the new DLC maps when it comes out.
Of course, these are just assumptions and nothing can be proven by these results.
2. Distribution of wins per map
Next we have distribution of wins per map. Team nations can be changed in server settings but their number (1 or 2) is where their spawn is on the map.
“95% Conf.” tells fraction of wins of the team who has more wins. Smaller interval -> more accurate. “Unbalance” indicates how much 95% Conf. interval’s closer edge differs from the 0.5, if at all. One # = 0.005
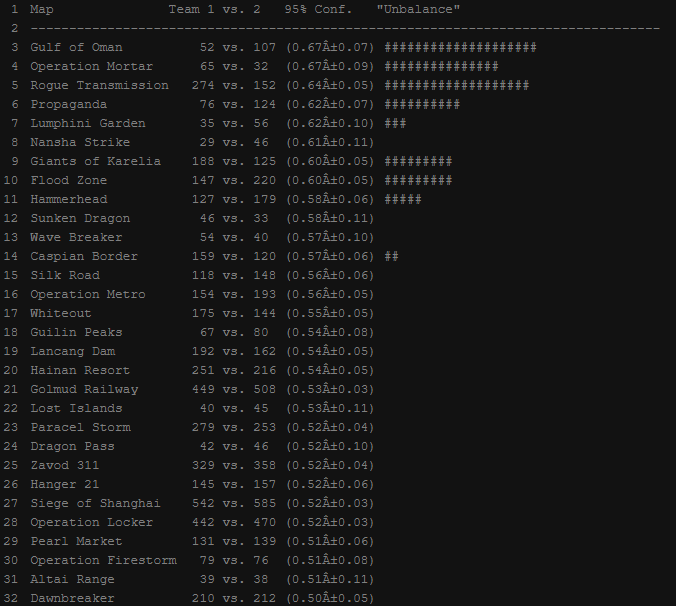
Maps are mostly balanced in statistical vision with some exceptions. Most unbalanced maps are big vehicle maps which include lots of things to balance and the size just makes it worse.
For some maps I wouldn’t dare to assume if they are unbalanced or not due to lack of samples, especially after considering how sample was taken.
3. Distribution of winner team’s sum of score/rank (“rank stacking”)
Here we check if sum of rank per team affects the outcome of the game, inspired by my personal hatred towards clan/group stacking.
I calculated sum of ranks and scores (based on score needed for rank) of both teams, then substracted loser’s sums from winner’s (I simply use terms “rank” and “score” later on),
giving us nice and simple sample of “how much more sum rank/score winner had”. Why I included score? Because gaining ranks is non-linear so we can’t substract ranks that simply, but I decided to give it a shot.
Image of distribution spoilered due to bright-white background of plot (at least burns my eyes with forum’s background color).
"Distribution of variables."
Chart currently N/A
4. Player’s “skill” versus time played (Learning curve)
3VerstsNorth requested a look at how players’ skill improves as a function of time played, so lets get to it.
First lets define skill: We have few measurements for this like SPM, KD and KPM. They all tell bit about the player but not everything (eg. Player with KD just might be camper who doesn’t help the team).
Lets combine these all into one variable as pmax suggested me by summing z-values of SPM, KPM and log(KD). Lets see the plot of this z-product with observations rounded to closest 10 hours.
"Played time vs. z-product"
Chart currently N/A
There’s a clear pattern here: Player improves rapidly in first 200h but improving gradually slows down. The pattern is so clear we could try fitting a regression model to find out some values for this:
"Fitted regression model with formula"
[Chart currently N/A]
Formula: z_product = -4.37134 + 0.88833*ln(hours_played)
p-values
Almost perfect fit, and this is what learning curves seem to be like quite often (Ask 3VerstsNorth, he seems to be acquainted with this). Tests confirm there’s a definetly a connection between the two and high R² indicates that time played explains much of the variance of z-product.
Again, in a nutshell: For about first 100 hours players “skill” doubles/triples. However after that it takes about 300h more to double “skill”. After this point data is too scattered to say anything for sure but seems to follow logarithmic function.
Update 21st Jan
3VN requested analysing first 50h of gameplay time.
"Played time vs. skill with 1-50h"
[Chart currently N/A]
Formula: z_product = -3.46490 + 0.72937*ln(hours_played)
p-values
5. Effects of capturing/defending flags on win/lose ratio and SPM (“Does PTFOing help?”)
Does PTFOing really help you to gain more score? Well lets find out!
Lets use flag captures/defends from conquest games as an indicator of “PTFOing” against win/lose ratio and SPM. Quite simply, we then calculate correlations between these different variables.
Correlation in short: Higher the correlation (closer to 1.0 or -1.0) indicates of dependency/connection between the two variables. Positive indicates of rising line, negative of descending line. Doesn’t tell if one causes the another!
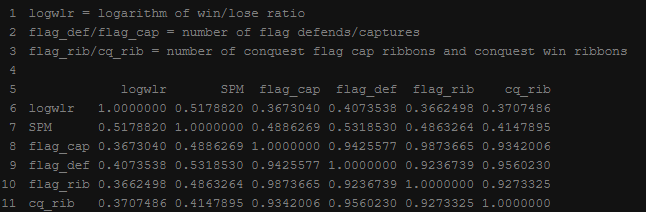
I used Spearman’s correlation to compensate for scattered values and heavy outliers. All p-values
As a result we have quite high correlations: logwlr is about ~0.4 for objective related variables which is reasonably high and clearly indicates of a connection between these two.
SPM correlates even better with objective based variables. Conquest win ribbons correlating very strongly with flag variables can be explained by the fact you get both ribbons just by playing games, but it’s still pretty high.
So basically: Yes, PTFOing improves your chances of winning and gives you more score, now with statistical proof. HOWEVER , this doesn’t mean PTFOing makes you win always! It just means there’s a connection between the two!
Update 21st Jan
People suggested diving flag captures/defends with games played to get something similar to flags capture per game. Problem is that played games variable also includes rounds of other gamemodes, but lets give it a shot.
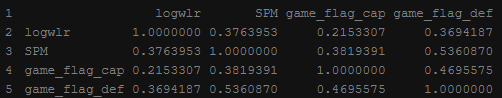
Correlation between flag captures and win/lose ratio dropped almost 0.2 which is quite a bit, meanwhile flag defends only dropped by ~0.04 which could be well explained by the fact played rounds also included other gamemodes than conquest.
Also correlation with SPM had same kind of effect: Defending of flags didn’t change and capturing flags lowered considerably. This seems to support the conclusion/idea that defending flags is more beneficial for your score and possibly to your team.
6. Method of gathering the sample & Things to note
I am just going to shamelessly copy/paste my earlier text here:
@Using Bf4Stats: I just later noticed pmax posted more of those battlelog API urls which have fresh soldier data…
The “rules” I have for selecting reports:
- Only Conquest Large or Conquest
- PC only
- Max starting tickets 1200
- Remove players who had
- Report happened less than 4 months ago
- Only ranked games
- Remove players who had
The rules are there to avoid having unusual outliers in the sample. Unranked games could have any set of rules, servers with high ticket count can have 300 different players in one game, etcetc.
I had 10k battlereports for analysing and ~40k players. I tried to keep the sample taking as random as possible but I am unsure how bf4stats works with their server listing so there might be biased to some direction, however I believe these serve us at least a general picture of the game’s underlaying statistics.
For anybody who is interested on having this data just contact me. Currently it’s in ugly python pickle files which are bit clumsy so I need to refine it bit.
Also if you have more questions regarding statistics of BF4 just go ahead and ask, I’ll see what I can do.
And one more thing : Thank you for being such an awesome community! It is nice to share something like this with you guys  .
.
Especially big thanks to 3VerstsNorth for being an awesome doctor and researcher in general. You keep inspiring me! pmax also inspired me with his own research and with lot of help and tips he gave to me!